llama4 실제 구현 결과 비교: Scout VS Maverick

당연히 Maverick이 압도적이겠지만
unsloth/Llama-4-Scout-17B-16E-Instruct-GGUF/Llama-4-Scout-17B-16E-Instruct-UD-IQ2_XXS.gguf
unsloth/Llama-4-Maverick-17B-128E-Instruct-GGUF/UD-IQ1_S/Llama-4-Maverick-17B-128E-Instruct-UD-IQ1_S-00001-of-00003.gguf
이 두개를 비교하고자 한다.
비교 방법은 코드 생성을 시켜서 그 코드가 의도한 결과가 나오는지 비교하는것이다.
프롬프트
"
 Write a single `app.py` file using **FastAPI** that does the following:

 1. **GPU Monitoring Logger**:
    - Run `nvidia-smi` every 1 second.
    - Parse and extract the following per-GPU metrics:
      - **Memory usage (used / total)**
      - **Power consumption**
      - **Temperature**
    - Append the data to a log file in a structured format (e.g., CSV or JSON lines).

 2. **Trend Visualization Web Interface**:
    - Build a FastAPI route (e.g., `/`) that:
      - Reads the log file.
      - Displays an HTML page using **Jinja2 templates** (embedded in Python code).
      - Renders the GPU data using **Plotly** charts.

 3. **Chart Layout**:
    - For each GPU, display **3 horizontal charts in one row**:
      - Memory usage over time
      - Power consumption over time
      - Temperature over time
    - If there are multiple GPUs (e.g., 3), stack these rows vertically — so there are 3 rows of charts total.
    - All charts should be visible in one screen for comparison, with consistent axes and styling.

 4. **Requirements**:
    - The HTML template and CSS should be defined **inline** in the Python file (no external files).
    - Use **Plotly.js** for chart rendering.
    - The whole solution should be self-contained in a **single Python file**.
"
Maverick
Maverick 수행 결과
llama_perf_sampler_print:    sampling time =      84.80 ms /  1428 runs   (    0.06 ms per token, 16840.62 tokens per second)
llama_perf_context_print:        load time =   57084.71 ms
llama_perf_context_print: prompt eval time =   31967.28 ms /   239 tokens (  133.75 ms per token,     7.48 tokens per second)
llama_perf_context_print:        eval time =   33200.66 ms /  1188 runs   (   27.95 ms per token,    35.78 tokens per second)
llama_perf_context_print:       total time =   65478.27 ms /  1427 tokens
코드 생성 결과
from fastapi import FastAPI, Request
from fastapi.responses import HTMLResponse
from fastapi.templating import Jinja2Templates
from plotly import graph_objects as go
from plotly.offline import plot
from pydantic import BaseModel
import subprocess
import csv
import json
import threading
import time
import os

app = FastAPI()

# GPU Monitoring Logger Configuration
GPU_LOG_FILE = "gpu_log.jsonl"

# GPU Monitoring Logger: Run nvidia-smi every 1 second and log data
def gpu_monitoring_logger():
    while True:
        result = subprocess.run(["nvidia-smi", "--query-gpu=count", "--format=csv"], stdout=subprocess.PIPE)
        num_gpus = int(result.stdout.decode().strip().split("\n")[-1])

        result = subprocess.run(["nvidia-smi", "--query-gpu=memory.used,memory.total,power.draw,temperature.gpu", "--format=csv"], stdout=subprocess.PIPE)
        rows = result.stdout.decode().strip().split("\n")[1:]
        data = []
        for row in rows:
            values = row.split(",")
            gpu_data = {
                "memory_used": int(values[0].strip()),
                "memory_total": int(values[1].strip()),
                "power_consumption": float(values[2].strip().replace("W", "")),
                "temperature": int(values[3].strip().replace("C", ""))
            }
            data.append(gpu_data)

        with open(GPU_LOG_FILE, "a") as f:
            for gpu_data in data:
                f.write(json.dumps(gpu_data) + "\n")

        time.sleep(1)

# Start GPU Monitoring Logger in a separate thread
if not os.path.exists(GPU_LOG_FILE):
    with open(GPU_LOG_FILE, "w") as f:
        pass
threading.Thread(target=gpu_monitoring_logger).start()

# Trend Visualization Web Interface: Read log file and display HTML page
templates = Jinja2Templates(directory=".")

@app.get("/")
async def index(request: Request):
    gpu_data = []
    with open(GPU_LOG_FILE, "r") as f:
        lines = f.readlines()
        num_gpus = len(lines) // len(lines) if len(lines) > 0 else 0
        for i in range(num_gpus):
            gpu_memory_used = []
            gpu_power_consumption = []
            gpu_temperature = []
            for line in lines[i::num_gpus]:
                data = json.loads(line.strip())
                gpu_memory_used.append(data["memory_used"])
                gpu_power_consumption.append(data["power_consumption"])
                gpu_temperature.append(data["temperature"])
            gpu_data.append({
                "memory_used": gpu_memory_used,
                "power_consumption": gpu_power_consumption,
                "temperature": gpu_temperature
            })

    # Generate Plotly charts
    figs = []
    for i, gpu in enumerate(gpu_data):
        fig = go.Figure(
            layout=go.Layout(
                height=300,
                width=1200,
                margin=go.layout.Margin(l=20, r=20, t=20, b=20)
            )
        )
        fig.add_trace(go.Scatter(x=list(range(len(gpu["memory_used"]))), y=gpu["memory_used"], mode="lines"))
        fig.add_trace(go.Scatter(x=list(range(len(gpu["power_consumption"]))), y=gpu["power_consumption"], mode="lines"))
        fig.add_trace(go.Scatter(x=list(range(len(gpu["temperature"]))), y=gpu["temperature"], mode="lines"))
        figs.append(plot(fig, output_type="div"))

    # Render HTML template with Plotly charts
    html_template = """
    <!DOCTYPE html>
    <html>
    <head>
        <style>
            .chart {
                width: 100%;
                height: 300px;
                margin-bottom: 20px;
            }
        </style>
    </head>
    <body>
        {% for fig in figs %}
        <div class="chart">{{ fig }}</div>
        {% endfor %}
        <script src="https://cdn.plotly.com/plotly-2.12.1.min.js"></script>
    </body>
    </html>
    """

    return HTMLResponse(templates.TemplateResponse(
        "index.html",
        {"request": request, "figs": figs},
        template_string=html_template
    ))

if __name__ == "__main__":
    import uvicorn
    uvicorn.run(app, host="0.0.0.0", port=8000)
실행 결과
실망스럽게도 실행 에러
# 브라우저
Internal Server Error
# 서버 실행 직후 에러
Exception in thread Thread-1 (gpu_monitoring_logger):
Traceback (most recent call last):
File "/usr/lib/python3.10/threading.py", line 1016, in _bootstrap_inner
self.run()
File "/usr/lib/python3.10/threading.py", line 953, in run
self._target(*self._args, **self._kwargs)
File "/home/vtopia/git/app.py", line 31, in gpu_monitoring_logger
"memory_used": int(values[0].strip()),
ValueError: invalid literal for int() with base 10: '15 MiB'
# 페이지 접속 시 에러
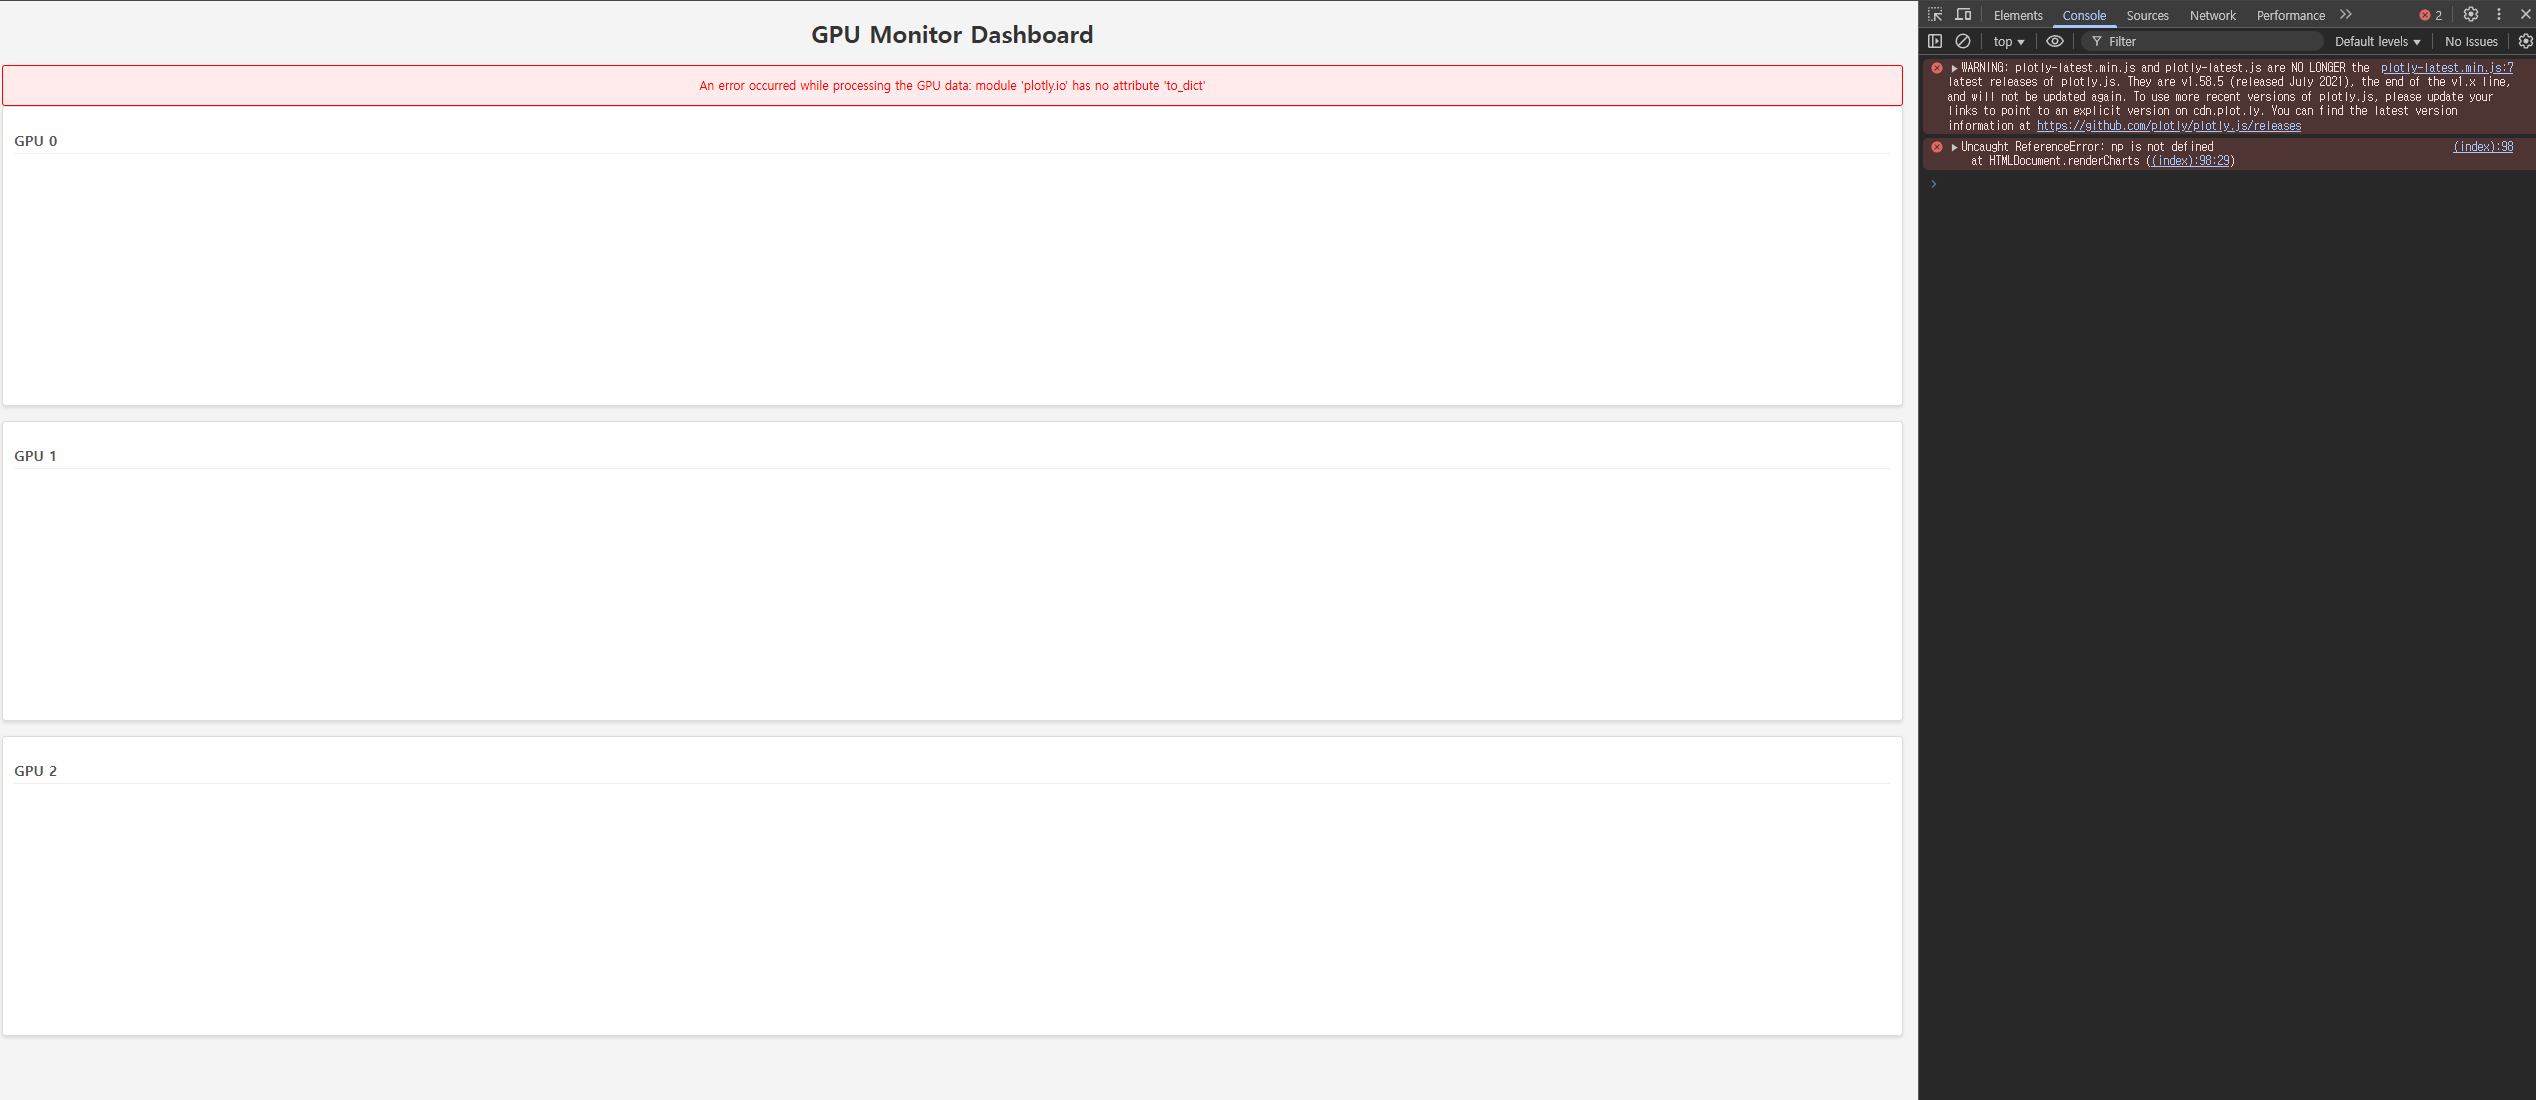
jinja2.exceptions.TemplateNotFound: 'index.html' not found in search path: '.'GPT를 통해 오류 수정하고 다시 시도
o4-mini-high에게 코드를 보정하라고 하고, 수행하니 gpt도 잘못된 cdn을 응답해서 에러를 얻음. 그래서 직접 수정함.
어쨋건 maverick이 요구사항을 듣고 만들려는 최종 결과는 아래와 같다.
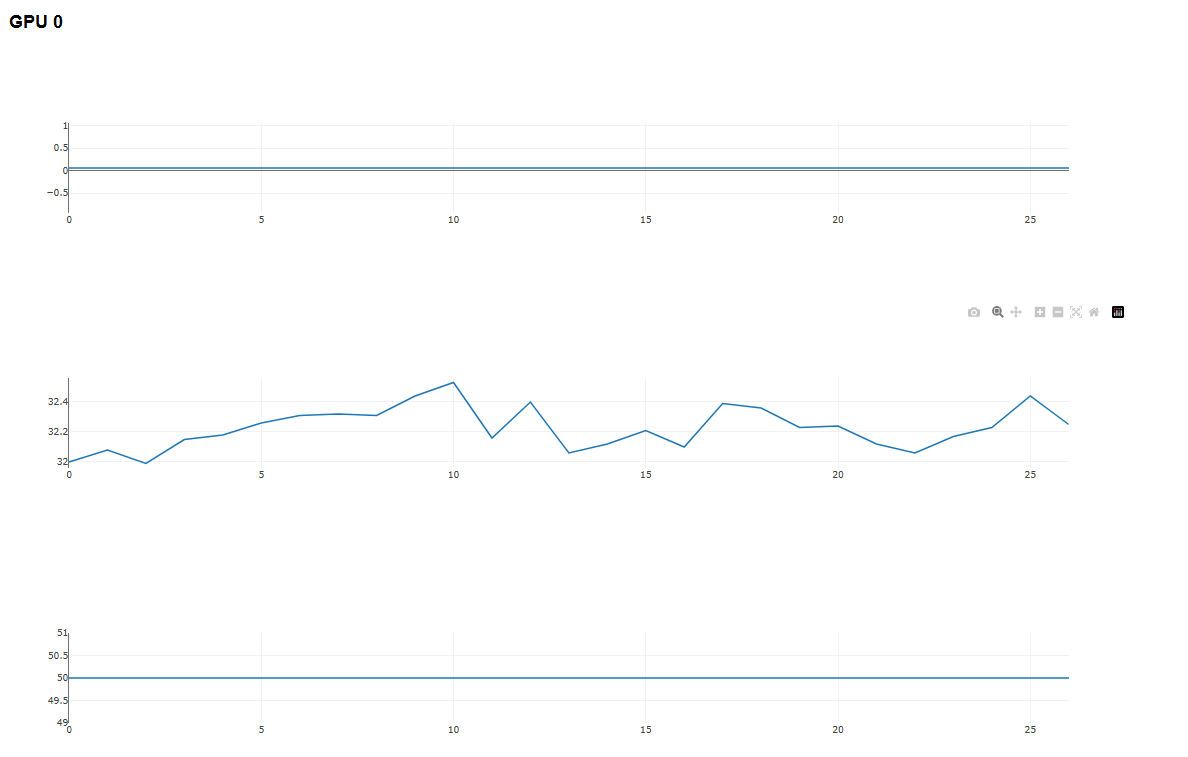
기타 정보
load_tensors: loading model tensors, this can take a while... (mmap = true)
load_tensors: offloading 48 repeating layers to GPU
load_tensors: offloading output layer to GPU
load_tensors: offloaded 49/49 layers to GPU
load_tensors:   CPU_Mapped model buffer size = 46612.73 MiB
load_tensors:   CPU_Mapped model buffer size = 47048.12 MiB
load_tensors:   CPU_Mapped model buffer size = 26936.60 MiB
load_tensors:        CUDA0 model buffer size =  1692.70 MiB
load_tensors:        CUDA1 model buffer size =  1556.64 MiB
load_tensors:        CUDA2 model buffer size =  2214.41 MiB
.......................................................................
llama_context: constructing llama_context
llama_context: n_seq_max     = 1
llama_context: n_ctx         = 16384
llama_context: n_ctx_per_seq = 16384
llama_context: n_batch       = 2048
llama_context: n_ubatch      = 512
llama_context: causal_attn   = 1
llama_context: flash_attn    = 0
llama_context: freq_base     = 500000.0
llama_context: freq_scale    = 1
llama_context: n_ctx_per_seq (16384) < n_ctx_train (1048576) -- the full capacity of the model will not be utilized
llama_context:  CUDA_Host  output buffer size =     0.77 MiB
init: kv_size = 16384, offload = 1, type_k = 'f16', type_v = 'f16', n_layer = 48, can_shift = 1
init:      CUDA0 KV buffer size =  1088.00 MiB
init:      CUDA1 KV buffer size =  1024.00 MiB
init:      CUDA2 KV buffer size =   960.00 MiB
llama_context: KV self size  = 3072.00 MiB, K (f16): 1536.00 MiB, V (f16): 1536.00 MiB
llama_context:      CUDA0 compute buffer size =  5710.75 MiB
llama_context:      CUDA1 compute buffer size =  1384.00 MiB
llama_context:      CUDA2 compute buffer size =  1384.01 MiB
llama_context:  CUDA_Host compute buffer size =    74.01 MiB
llama_context: graph nodes  = 2034
llama_context: graph splits = 92 (with bs=512), 52 (with bs=1)
Scout 결과
Scout 수행 결과
llama_perf_sampler_print:    sampling time =     123.17 ms /  1787 runs   (    0.07 ms per token, 14508.99 tokens per second)
llama_perf_context_print:        load time =   15509.03 ms
llama_perf_context_print: prompt eval time =    1398.24 ms /   238 tokens (    5.87 ms per token,   170.21 tokens per second)
llama_perf_context_print:        eval time =   58426.60 ms /  1548 runs   (   37.74 ms per token,    26.49 tokens per second)
llama_perf_context_print:       total time =   60241.79 ms /  1786 tokens
코드 생성 결과
maverick과 다르게 pandas를 굳이? 사용했다
import subprocess
import json
import time
import csv
from fastapi import FastAPI, Request
from fastapi.responses import HTMLResponse
import plotly
import plotly.graph_objs as go
from plotly.offline import iplot
import pandas as pd
from jinja2 import Template

app = FastAPI()

# GPU Monitoring Logger
import logging
logging.basicConfig(filename='gpu_log.csv', level=logging.INFO, format='%(message)s')

def get_gpu_data():
    try:
        result = subprocess.run(['nvidia-smi', '-q', '-d', '0'], stdout=subprocess.PIPE, stderr=subprocess.PIPE)
        output = result.stdout.decode('utf-8').split('\n')
        gpu_data = {}
        for line in output:
            if 'gpu' in line.lower():
                gpu_id = line.split(':')[0].strip().split(' ')[-1]
                gpu_data[gpu_id] = {}
            elif 'memory' in line.lower():
                memory_used = line.split(':')[1].strip().split(' ')[0]
                memory_total = line.split(':')[1].strip().split(' ')[-1]
                gpu_data[gpu_id]['memory_used'] = memory_used
                gpu_data[gpu_id]['memory_total'] = memory_total
            elif 'power' in line.lower():
                power_consumption = line.split(':')[1].strip().split(' ')[0]
                gpu_data[gpu_id]['power_consumption'] = power_consumption
            elif 'temperature' in line.lower():
                temperature = line.split(':')[1].strip().split(' ')[0]
                gpu_data[gpu_id]['temperature'] = temperature
        return gpu_data
    except Exception as e:
        logging.error(f"Error fetching GPU data: {str(e)}")
        return {}

def log_gpu_data():
    gpu_data = get_gpu_data()
    if gpu_data:
        for gpu_id, metrics in gpu_data.items():
            logging.info(f"{gpu_id},{metrics['memory_used']},{metrics['memory_total']},{metrics['power_consumption']},{metrics['temperature']}")

# Run nvidia-smi every 1 second and log
import threading
def monitor_gpu():
    while True:
        log_gpu_data()
        time.sleep(1)

threading.Thread(target=monitor_gpu).start()

# Trend Visualization Web Interface
html_template = """
<!DOCTYPE html>
<html>
<head>
    <title>GPU Monitoring</title>
    <script src="https://cdn.plotly.com/plotly-2.16.1.min.js"></script>
    <style>
        body {
            font-family: Arial, sans-serif;
        }
        .chart {
            width: 100%;
            height: 200px;
        }
    </style>
</head>
<body>
    {% for gpu_id, data in gpu_data.items() %}
    <div>
        <h2>GPU {{ gpu_id }}</h2>
        <div class="chart" id="memory-{{ gpu_id }}"></div>
        <div class="chart" id="power-{{ gpu_id }}"></div>
        <div class="chart" id="temperature-{{ gpu_id }}"></div>
        <script>
            var memoryData = {{ memory_data | tojson }};
            var powerData = {{ power_data | tojson }};
            var temperatureData = {{ temperature_data | tojson }};
            var gpuId = "{{ gpu_id }}";

            Plotly.newPlot('memory-' + gpuId, [{
                x: memoryData.map(function(x) { return x[0]; }),
                y: memoryData.map(function(x) { return x[1]; }),
                type: 'scatter'
            }], {
                title: 'Memory Usage',
                yaxis: { title: 'Memory Used' }
            });

            Plotly.newPlot('power-' + gpuId, [{
                x: powerData.map(function(x) { return x[0]; }),
                y: powerData.map(function(x) { return x[1]; }),
                type: 'scatter'
            }], {
                title: 'Power Consumption',
                yaxis: { title: 'Power' }
            });

            Plotly.newPlot('temperature-' + gpuId, [{
                x: temperatureData.map(function(x) { return x[0]; }),
                y: temperatureData.map(function(x) { return x[1]; }),
                type: 'scatter'
            }], {
                title: 'Temperature',
                yaxis: { title: 'Temperature' }
            });
        </script>
    </div>
    {% endfor %}
</body>
</html>
"""

@app.get("/")
async def index():
    try:
        with open('gpu_log.csv', 'r') as f:
            gpu_data = {}
            reader = csv.reader(f)
            for row in reader:
                if len(row) == 5:
                    gpu_id, memory_used, memory_total, power_consumption, temperature = row
                    if gpu_id not in gpu_data:
                        gpu_data[gpu_id] = {'memory': [], 'power': [], 'temperature': []}
                    gpu_data[gpu_id]['memory'].append((len(gpu_data[gpu_id]['memory']), int(memory_used) / int(memory_total) * 100))
                    gpu_data[gpu_id]['power'].append((len(gpu_data[gpu_id]['power']), float(power_consumption)))
                    gpu_data[gpu_id]['temperature'].append((len(gpu_data[gpu_id]['temperature']), float(temperature)))

        html = Template(html_template).render(gpu_data=gpu_data, memory_data=json.dumps([x for gpu_id, data in gpu_data.items() for x in data['memory']]),
                                               power_data=json.dumps([x for gpu_id, data in gpu_data.items() for x in data['power']]),
                                               temperature_data=json.dumps([x for gpu_id, data in gpu_data.items() for x in data['temperature']]))
        return HTMLResponse(content=html, status_code=200)
    except Exception as e:
        return HTMLResponse(content=f"<html><body>Error: {str(e)}</body></html>", status_code=500)

if __name__ == "__main__":
    import uvicorn
    uvicorn.run(app, host="0.0.0.0", port=8000)
실행 결과
서버 에러가 안보여서 오! 했지만 결국 빈화면을 얻음
# 브라우저 콘솔 로그
plotly-2.16.1.min.js:1


Failed to load resource: net::ERR_NAME_NOT_RESOLVED
GPT로 보정하고 실행한 결과
먼저 앞선 maverick의 gpt 수정 응답 처럼 cdn만 에러만 보여서 같은 방식으로 직접 고치고 실행했지만, 코드에 문제가 있었다
(index):31 Uncaught TypeError: memoryData.map is not a function
    at (index):31:31
(anonymous) @ (index):31Understand this errorAI
(index):71 Uncaught TypeError: memoryData.map is not a function
    at (index):71:31
(anonymous) @ (index):71Understand this errorAI
(index):111 Uncaught TypeError: memoryData.map is not a function
    at (index):111:31
그래도 공평하게 maverick과 같은 프롬프트로 o4-mini-high로 코드를 수정시켰다
이번에도 어김없이 gpt는 cdn 에러를 발생시켰고 uvicorn 호출 코드도 잘못 짰다. o4-mini-high인데.. 거참
형제 모델이라 그런지 같은 디자인을 구현하였다
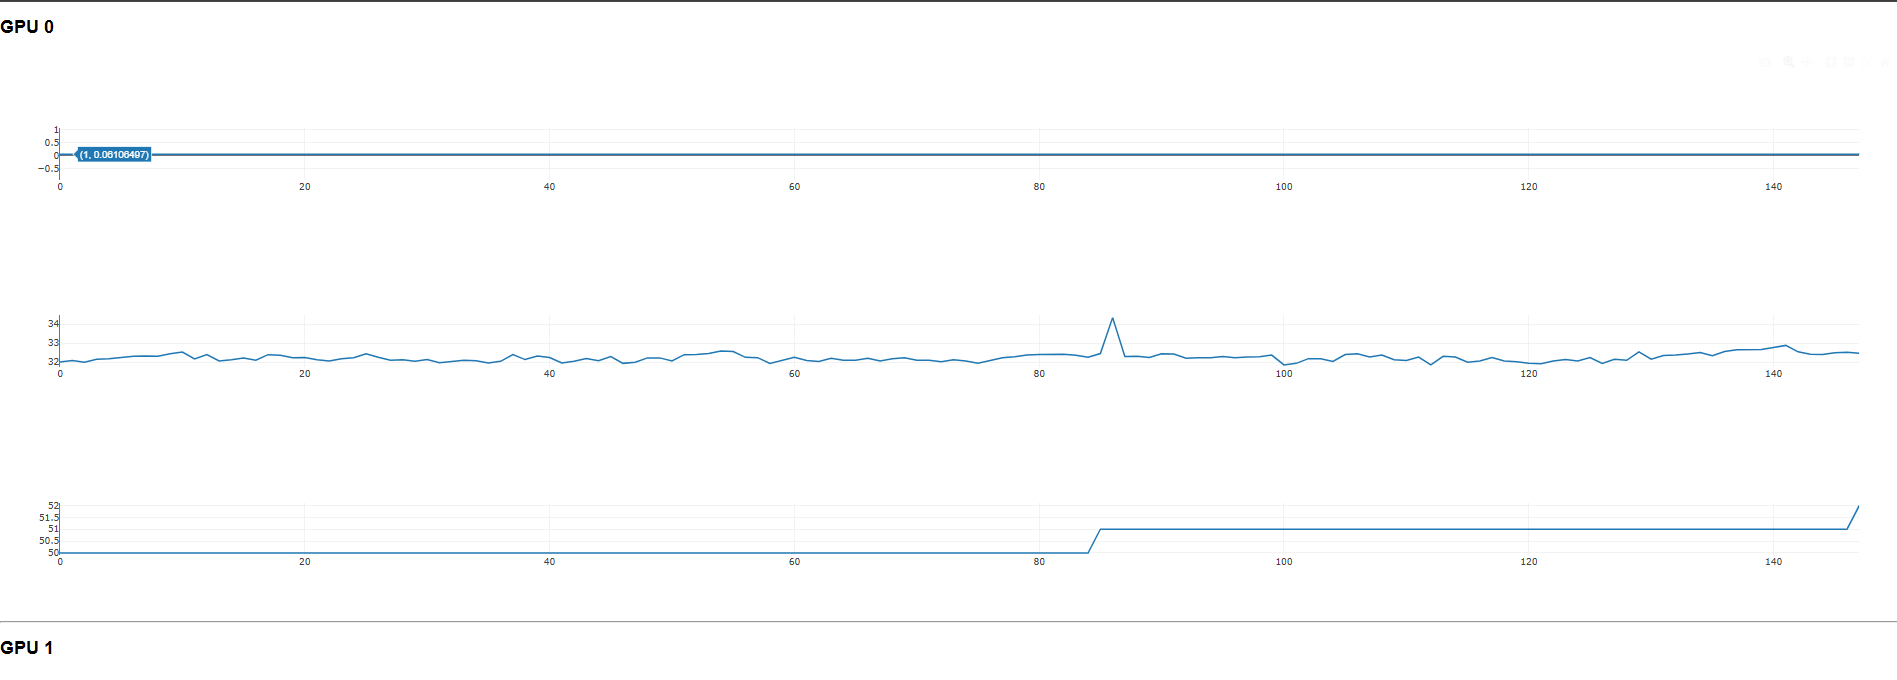
기타 정보
load_tensors: loading model tensors, this can take a while... (mmap = true)
load_tensors: offloading 48 repeating layers to GPU
load_tensors: offloading output layer to GPU
load_tensors: offloaded 49/49 layers to GPU
load_tensors:   CPU_Mapped model buffer size = 35041.62 MiB
load_tensors:        CUDA0 model buffer size =  1722.11 MiB
load_tensors:        CUDA1 model buffer size =  1683.48 MiB
load_tensors:        CUDA2 model buffer size =  2198.87 MiB
...................................................................................................
llama_context: constructing llama_context
llama_context: n_seq_max     = 1
llama_context: n_ctx         = 16384
llama_context: n_ctx_per_seq = 16384
llama_context: n_batch       = 2048
llama_context: n_ubatch      = 512
llama_context: causal_attn   = 1
llama_context: flash_attn    = 0
llama_context: freq_base     = 500000.0
llama_context: freq_scale    = 1
llama_context: n_ctx_per_seq (16384) < n_ctx_train (10485760) -- the full capacity of the model will not be utilized
llama_context:  CUDA_Host  output buffer size =     0.77 MiB
init: kv_size = 16384, offload = 1, type_k = 'f16', type_v = 'f16', n_layer = 48, can_shift = 1
init:      CUDA0 KV buffer size =  1088.00 MiB
init:      CUDA1 KV buffer size =  1024.00 MiB
init:      CUDA2 KV buffer size =   960.00 MiB
llama_context: KV self size  = 3072.00 MiB, K (f16): 1536.00 MiB, V (f16): 1536.00 MiB
llama_context:      CUDA0 compute buffer size =  1384.10 MiB
llama_context:      CUDA1 compute buffer size =  1384.00 MiB
llama_context:      CUDA2 compute buffer size =  1384.00 MiB
llama_context:  CUDA_Host compute buffer size =    74.01 MiB
llama_context: graph nodes  = 2514
llama_context: graph splits = 179 (with bs=512), 100 (with bs=1)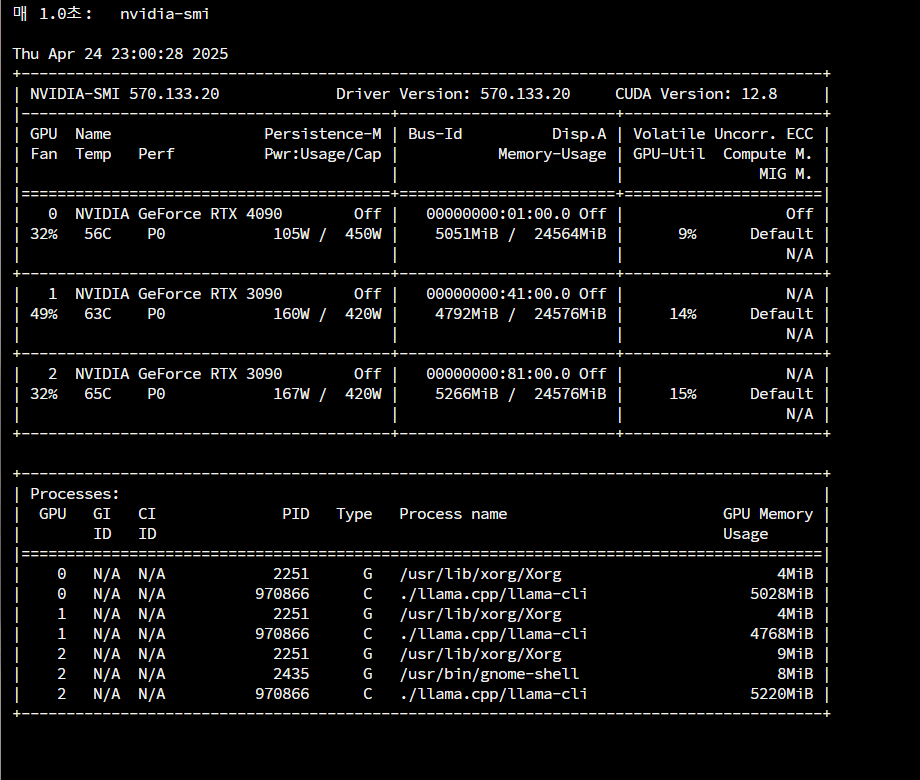
결론
Maverick이 그나마 좀 더 똑똑한거가 맞긴 하다
하지만 둘다 내 의도한 " GPU가 3개면 1줄에 메모리, 전력, 온도가 표현되고 이렇게 3줄로 표현됨"의 요구사항을 들어주지 않았다
번외 실험
같은 프롬프트로 claude 3.7, gemini 2.5 pro 0327, gpt o4-mini-high 에게 똑같은 프롬프트를 전달해봄
o4-mini-high
# 실행 후 서버 에러 발생

pct = int(mem_used) / int(mem_total) * 100
ValueError: invalid literal for int() with base 10: '15.0'
오류를 전달해서 다시 1차 보정을 시도
또 CDN 에러를... 어쨋건 직접 보정해주니 llama4와 같은 결과를 얻음
claude 3.7
# 실행 조차 실패

templates.env.loader.mapping["memory://templates/dashboard.html"] = HTML_TEMPLATE
AttributeError: 'FileSystemLoader' object has no attribute 'mapping'
정확히 에러 메시지를 다시 전달했다
하지만 또 에러다
# 이번엔 실행은 되지만 런타임에서 아래와 같이 에러 발생

  "memory_used": int(values[0].strip()),
ValueError: invalid literal for int() with base 10: '15 MiB'
gemini 2.5 pro 0327
가장 진보(?)된 결과다. 하지만 여전히 에러와 CDN을 잘못 했다. (그래도 없는 CDN을 넣진 않았다)
그리고 또 하나 마음에 든건 디자인을 신경써줬다는것이다.
공평하게, 정확히 서버의 에러 부분만 다시 전달했다
하지만 안타깝게도 claude처럼 2차 시도에서 정답을 알려주지 못했다
그럼에도 UI가 기대되어 한번 직접 수정을 하였다
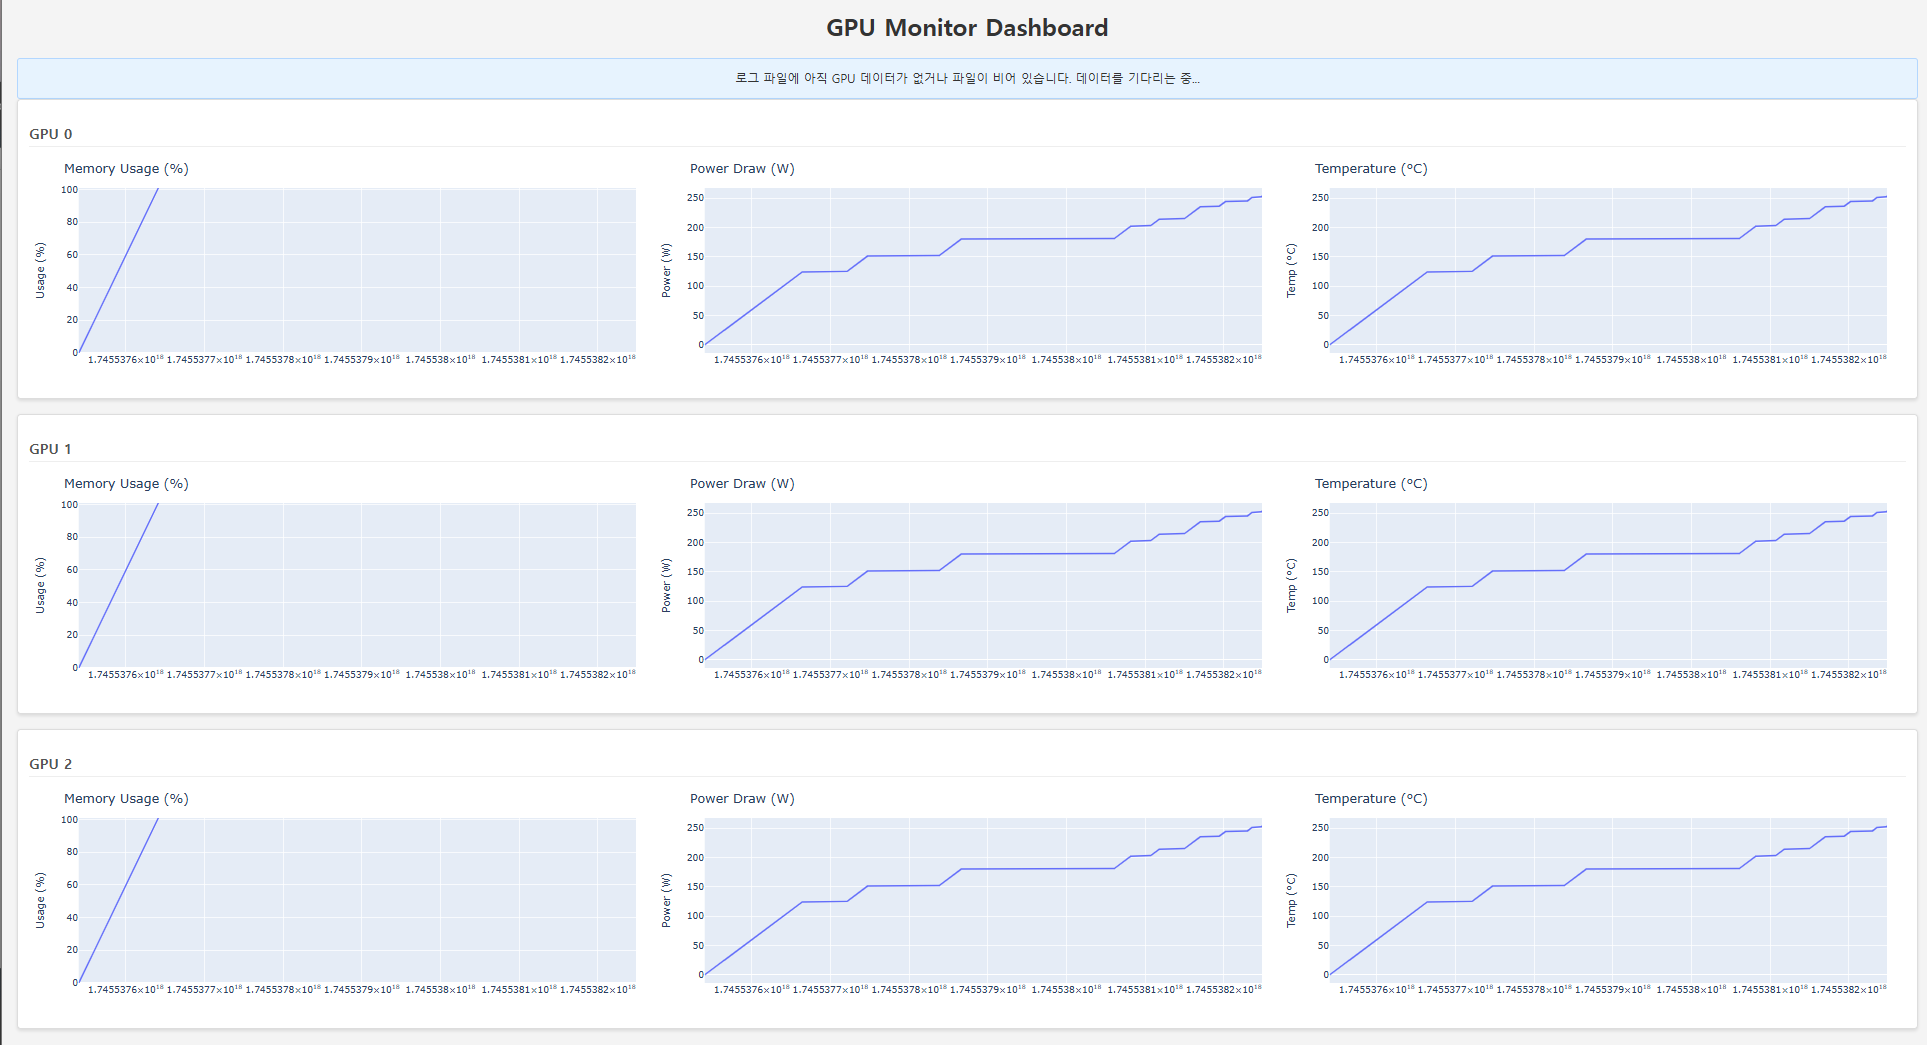
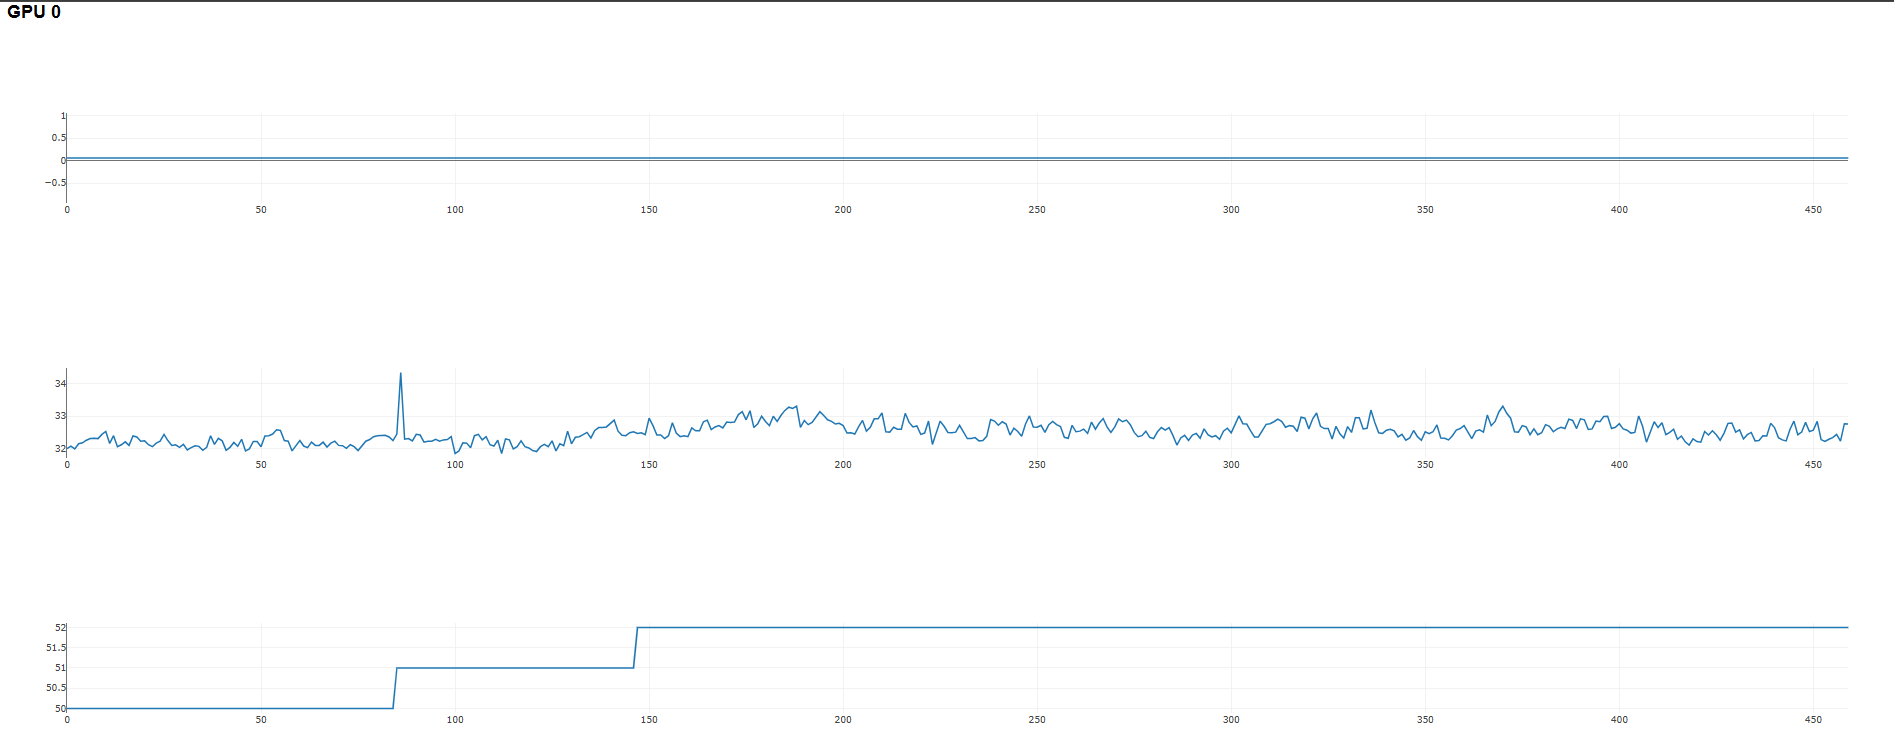
내 요구사항을 가장 잘 따른 UI 구현을 해주었다.
그런데.. 수치는 이상하다. 우상향 그래프라니..